End to End Tableau Project: Sales Data Analysis
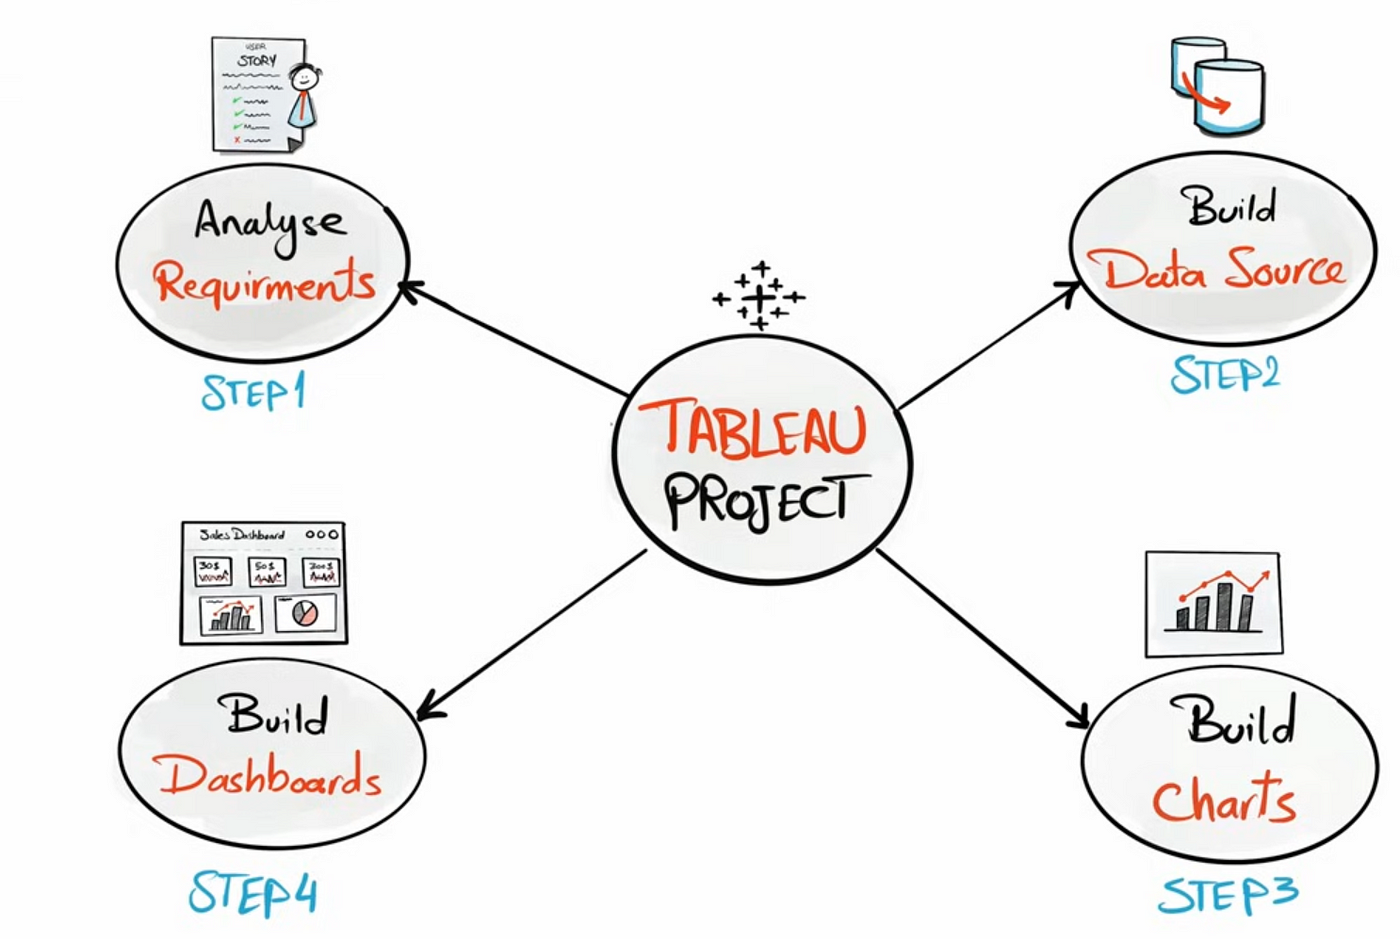
In this article, you will learn the step-by-step guide to implementing an industry-like Tableau project and I will also share best practices.
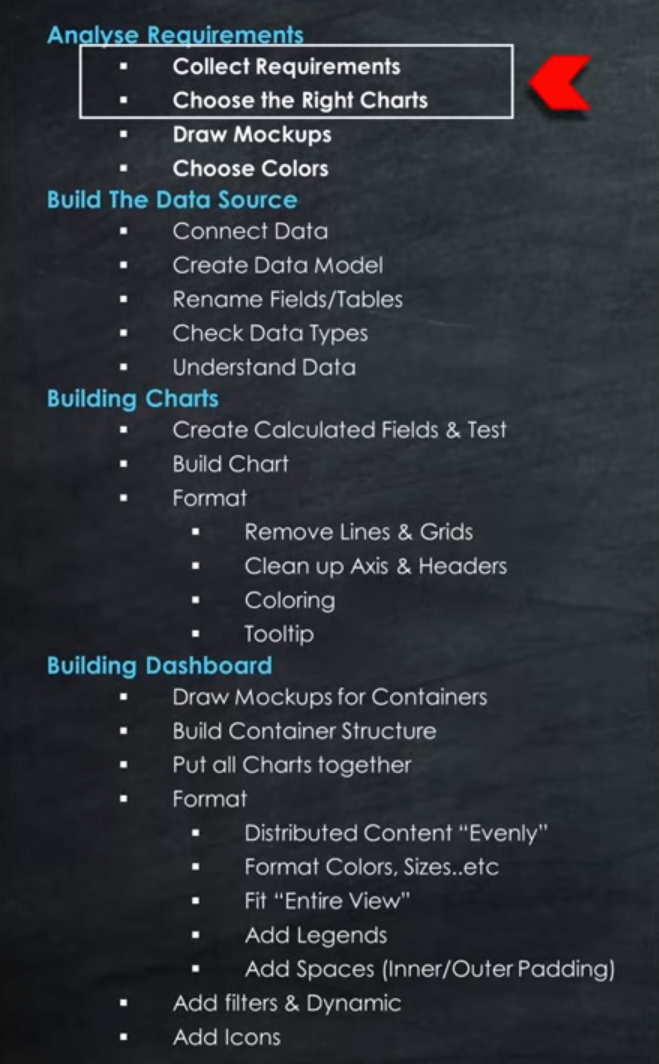
Step1: Requirements analysis
In this step you need to sit with the user to understand their requirements; usually, these requirements are documented in user stories.
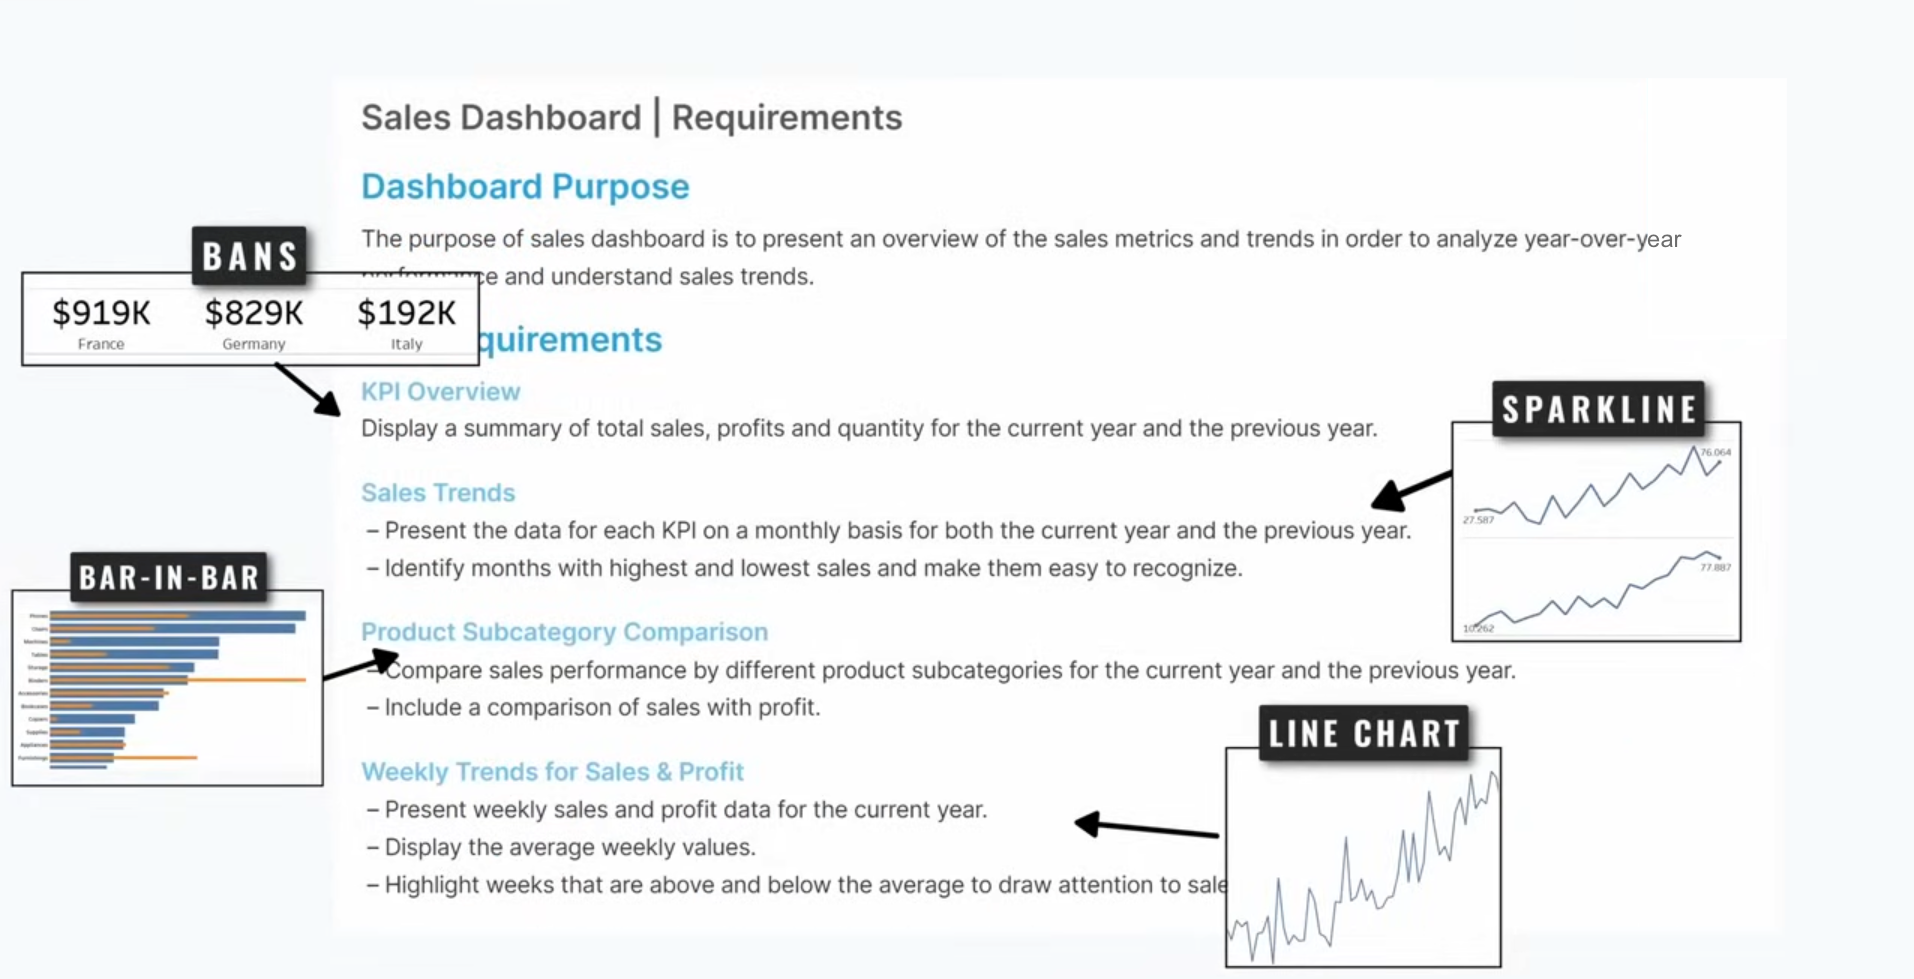
This user story outlines the specifications for building two dashboards using Tableau to help stakeholders, including sales managers and executives analyze sales performance and customers.
Step 2: Mockup
When designing the Dashboard Mockup it is important to pay attention to the Design and Interactivity requirements


Also part of the Mockup step is choosing the colors that usually should be fitting to the logo graphical chart.
Step 3: Building the Data Source
1. Connect to Data Sources or import data
The first step is to connect to the data sources or import the data, and Tableau has a wide choice of connectors for that step.
Next, it is important to understand the data to create the data model. The tables that have events will be the fact table which usually contains measures and dates and then you can create the data model by joining the fact table to the dimensions.

2. Check the data types
One important step to do at the start is to check the data types.
A very common issue is the float (e.g. Sales) read as a string and to solve that you can change the the file properties and edit the Locale.

3. Understand the data
You can not make great charts without a good understanding of the data. In this step try to drag and drop some measures and dimensions to the worksheets to see for example:
- Which countries is the data targeting
- Which product categories and subcategories
- Check if there are hierarchies, etc.
Step 4: Building the Charts
Now we will start to implement the charts based on the requirements.
You can find a detailed list of Tableau chart in my previous article
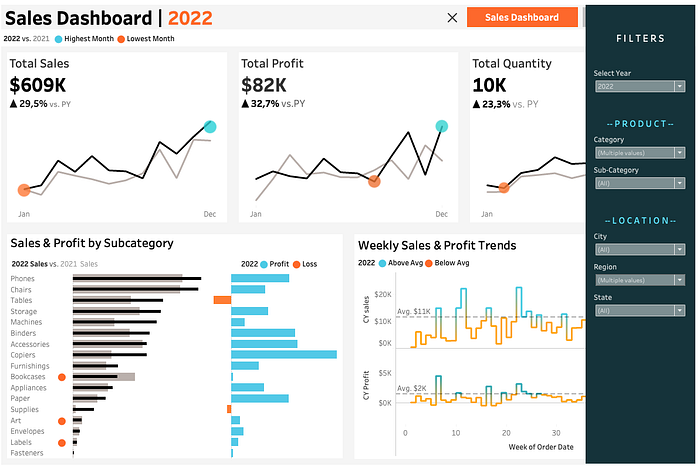
KPI Overview: Display a summary of the total number of customers, total sales per customer, and total number of orders for the current year and the previous year. => For this we will create a BAN with a line chart between the current and previous year.
Building the BAN Title
We need to show the current year sales (CY Sales), for this we need to implement a calculated field and we do the same for the previous year sales (PY Sales). To include the info in the BAN, make sure to paste the needed Calculated fields to the details under the Marks.
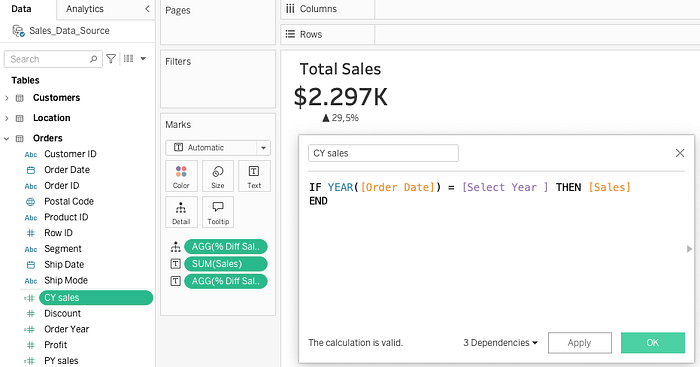
We also want to calculate the percentage of difference between the CY Sales and the PY Sales. We create a calculated field for that too.
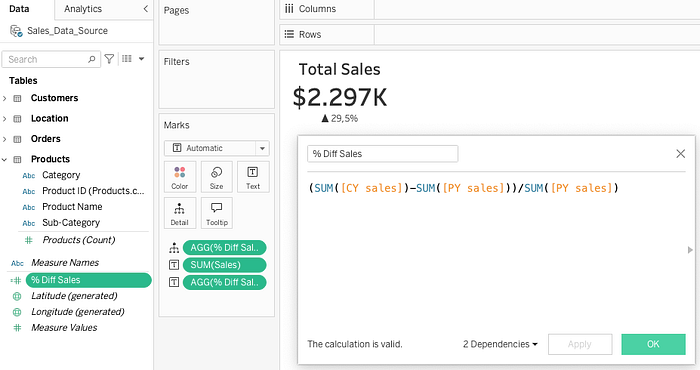
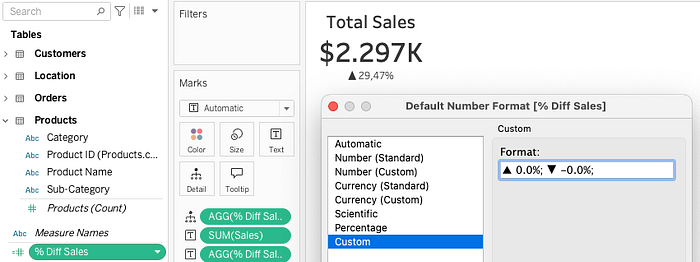
One trick to learn is to have the format with the triange up when the percentage is positive and the opposite when the percentage is negative. For that you need to right click on the %Diff Sales > Default Properties > Edit Number Fomat > custom and paste this: ▲ 0.00%; ▼ -0.00%;
Sparkline Chart
The first step is to create a line chart of the CY Sales and the PY Sales(measure values = sharing the same axis) over the month (which we turned to continuous) then to have a Sparkline, we need to calculate the Min and Max of the CY Sales using a Calculated Field Min/Max Sales.

Then we merge the two graphs together with the Dual Axis.

Tip: the cleaner the chart the better for a dashboard. Then what is left to do is clean up of the grid and lines, the coloring and formatting of the Tooltip.

When editing the tooltip, make sure to make everything paremterized via inserting the variables that are needed and importing them before to the tooltip in the Marks area.
Bar in Bar Chart of the Sales by Subcategory
This demands to superpose the sales of the CY and the PY in a bar chart.


Weekly Trends with Reference line (Average)


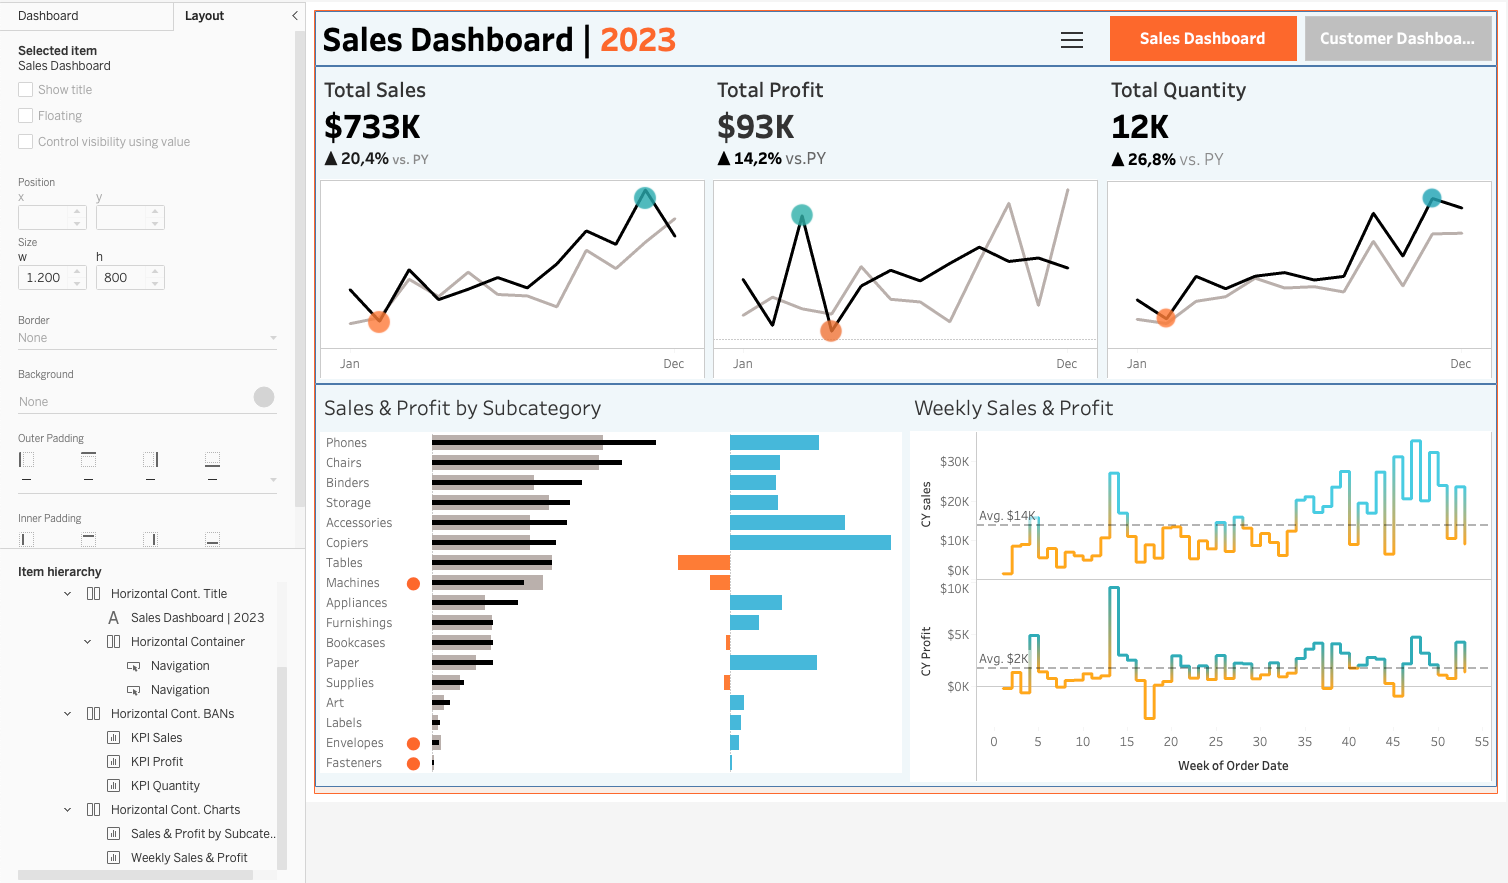
Step 5: Mockup Container
This step allows you to have a clean and easy drag and drop process of the worksheets in the corresponding place.

1. Adding the filter container
Since we have a filter container, we start with it the first and make it floating and since we have limited space, we can make it hidden & shown.

2. Creating the Containers Mockup in the dashboard with Blanks
In this step it is important to always check the item hierarchy with the vertical and horizontal containers and making the fit window option, you get a clean dashboard.
3. Adding the legends to the Charts
To add legends for each chart, make sure to follow the coloring and the details shown e.g. highest Sales & lowest Sales.

As you can notice, we can not plan everything at the start, sometimes after creating the dashboard and dropping the charts, you notice you need to add more containers to fit additional Information like the legend.

Adding more containers to fit the legends of the charts.


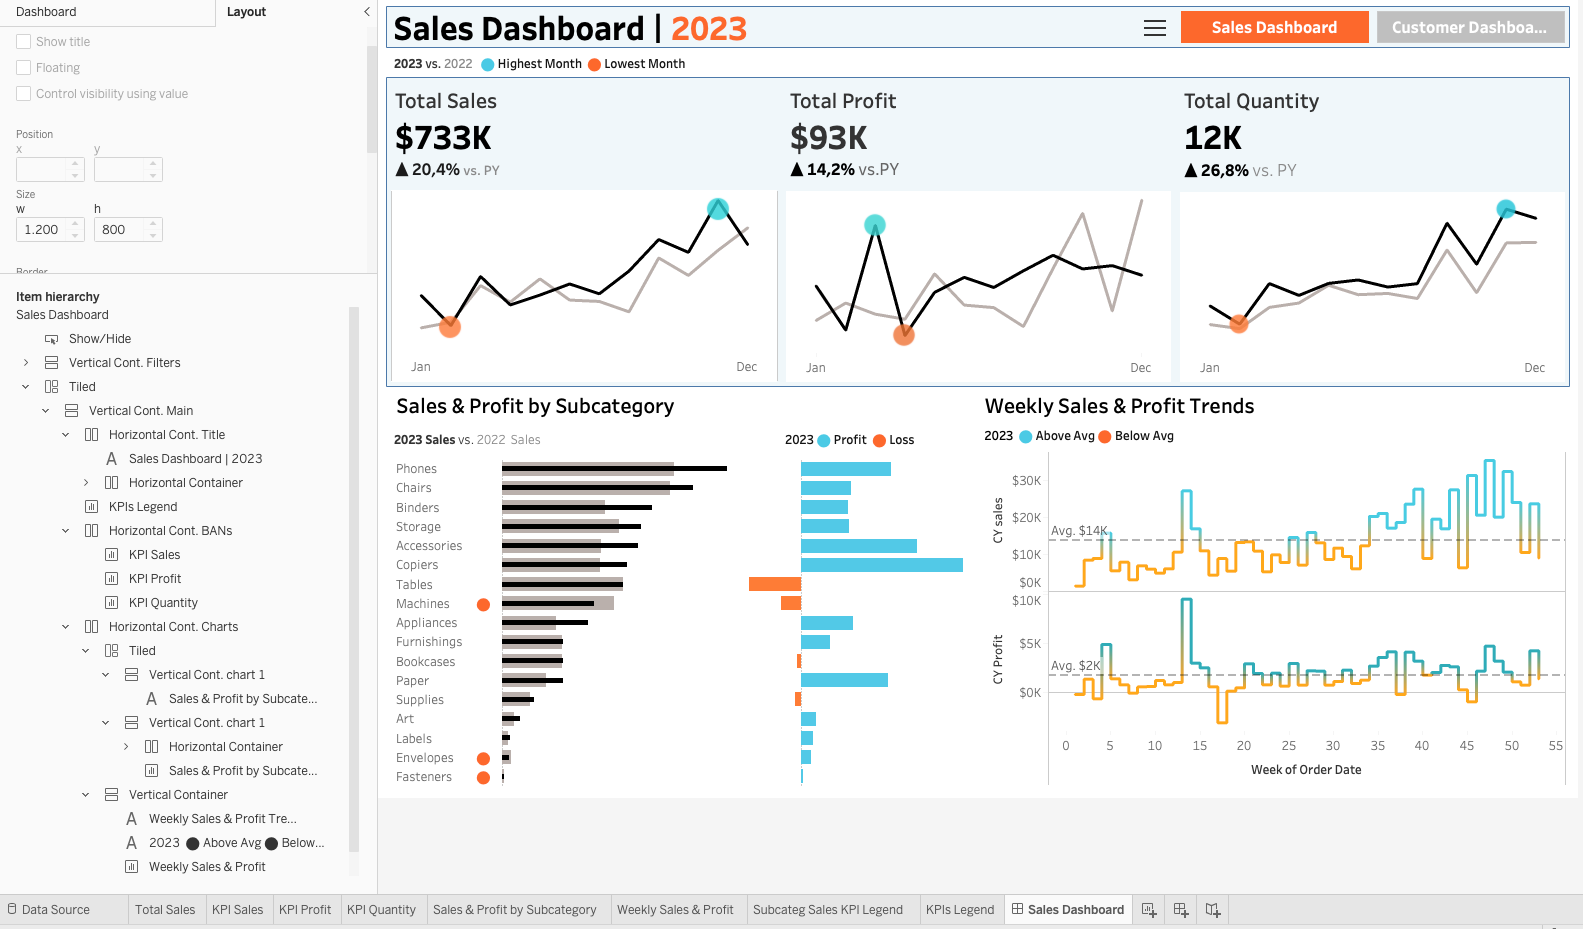
4. Adding spaces between the charts
Adding spaces between the charts will result in a creating a user friendly dashboard.
The spacing should be consistent for all the charts. So you need to decide on an outer padding to apply to all charts.

5. Filters & Dynamics
To fulfill the requirement to be able to filter data by product information like category and subcategory and by location information like region, state and city. We need to work on the filter container.

Then we need to make all the charts filterable by the dimensions by allowing filters to all data sources.


Final Filter modifications is adding some inner padding (10)
This was the end to end Tableau project of creating a Sales Dashboard. I hope you learned from it how to go through each steps.